Published Updated
Official 2025 figures from the Bank of Greece, ELSTAT, INSETE and Eurostat, and what they mean for Greek hotel owners planning ahead.
The Bank of Greece, ELSTAT, INSETE and Eurostat have each published full-year data on Greek tourism in 2025. Read together, they give hotel owners a clear view of where demand came from, where the money was spent and how the year was shaped.
The headline is growth. According to the Bank of Greece, travel receipts totalled €23,626.8m in 2025, up 9.4%, and the travel balance surplus reached €20,287.8m, up 8.0% on 2024. Growth at national level does not mean every hotel had a better year, though, and the detail matters more than the headline.
Below we set out what the data says about demand, the season, the regions and the hotel stock, and how we read it as operators.
Demand in 2025: more visitors, shorter stays, higher spend per night
The Bank of Greece counted 43,311.9 thousand non-resident inbound travellers in 2025, including cruise passengers, up 6.4%. The average length of stay fell 4.5% to 5.6 nights, from 5.9 in 2024. Average expenditure per trip rose 2.8% to €545.5, and average expenditure per overnight stay rose 7.7% to €96.6, from €89.7.
That last figure is what a visitor spends per night across everything in the trip: food, transport, shopping and accommodation. It is not a hotel room rate. What it does show is a visitor who comes for fewer nights and spends more on each one. For a hotel, shorter stays mean more check-ins, more turnover work and more distribution cost for every night sold.
ELSTAT’s 2025 accommodation data shows the same pattern. Arrivals at hotels, similar establishments, campsites and short-stay accommodation rose 2.8% to 38,189,833, and nights rose 2.2% to 156,347,283. Hotel establishments took 79.1% of those arrivals and 76.1% of the nights. Non-residents made up 73.8% of arrivals and 83.8% of nights, so the market is still driven by foreign demand.
The wider economic weight is large. INSETE’s study of tourism’s contribution puts the direct contribution at €32.4bn in 2025, up from €30.2bn in 2024, and direct plus indirect effects at 34.6% of GDP. INSETE estimates that every 1.0 of tourism revenue adds 2.65 to GDP.
The season behind the annual average
Annual bed-place occupancy in hotels and similar establishments was 50.7% in 2025, against 50.6% in 2024, according to ELSTAT. That average hides a steep curve. Bed-place occupancy was 12.7% in January and 18.0% in March, climbed to 51.6% in May, peaked at 81.3% in August, and was back to 38.8% by October. July to October alone accounted for 56.7% of arrivals and 63.7% of nights.
Eurostat’s summer peak release puts that in European context. Across the EU, 31.1% of 2025 tourism nights fell in the two busiest months. In Greece, July and August took 41.6%. Greek August nights were 20.5 times January’s, against 3.6 times for the EU as a whole.
There is some movement at the edges. INSETE’s 2025 inbound tourism report shows the third quarter’s share falling to 52.4% of arrivals and 52.9% of overnight stays, from 56.0% and 58.5% in 2019. The fourth quarter gained 2.8 percentage points of arrivals and 3.8 points of nights against 2019. We cover the month-by-month picture in our guide to how seasonality shapes Greek hotel revenue.
For an operator, the shape of the curve matters more than the annual average. Staff, maintenance, insurance and financing costs run for most of the year, while revenue arrives in a few months. A hotel that adds even a few busy weeks at each end of its season spreads those fixed costs over more nights sold, and it keeps a trained team for longer. That is often worth more than squeezing extra rate out of August, when demand is already at its peak.
Where the money lands: the regions
The Bank of Greece Border Survey recorded €22,607.1m in 2025 receipts, and five regions took 89.9% of it. The South Aegean led with €6,624.8m, followed by Attica at €5,838.2m, Crete at €4,342.6m, the Ionian Islands at €1,902.2m and Central Macedonia at €1,624.1m. Attica had the most visits, at 9,705.2 thousand.
Attica was the main driver of growth. INSETE’s inbound tourism report shows its share of visits rising from 16.2% in 2019 to 23.2% in 2025, which INSETE links to city-break tourism. In 2025, Attica added 920k visits, or 38% of the national increase, and €1,087m in receipts, or 54% of it. Crete’s receipts fell 5.0% and the Ionian’s fell 4.1%.
Bed-place occupancy follows a different order. ELSTAT puts the Ionian highest of those five regions at 59.7%, then Crete at 54.9%, the South Aegean at 51.8%, Central Macedonia at 51.6% and Attica at 51.2%. Regions that earn the most are not always the ones that fill their beds best, because season length and stock size differ. Our look at Athens hotels and the city-break market goes further into the capital.
The regional split also shapes the operating model. An island resort lives on a short, intense season and can close for the winter. A city hotel trades all year, with more even demand and a different mix of guests, from weekend visitors to business travellers. The two need different pricing, staffing and distribution plans, even when they sit in the same star category.
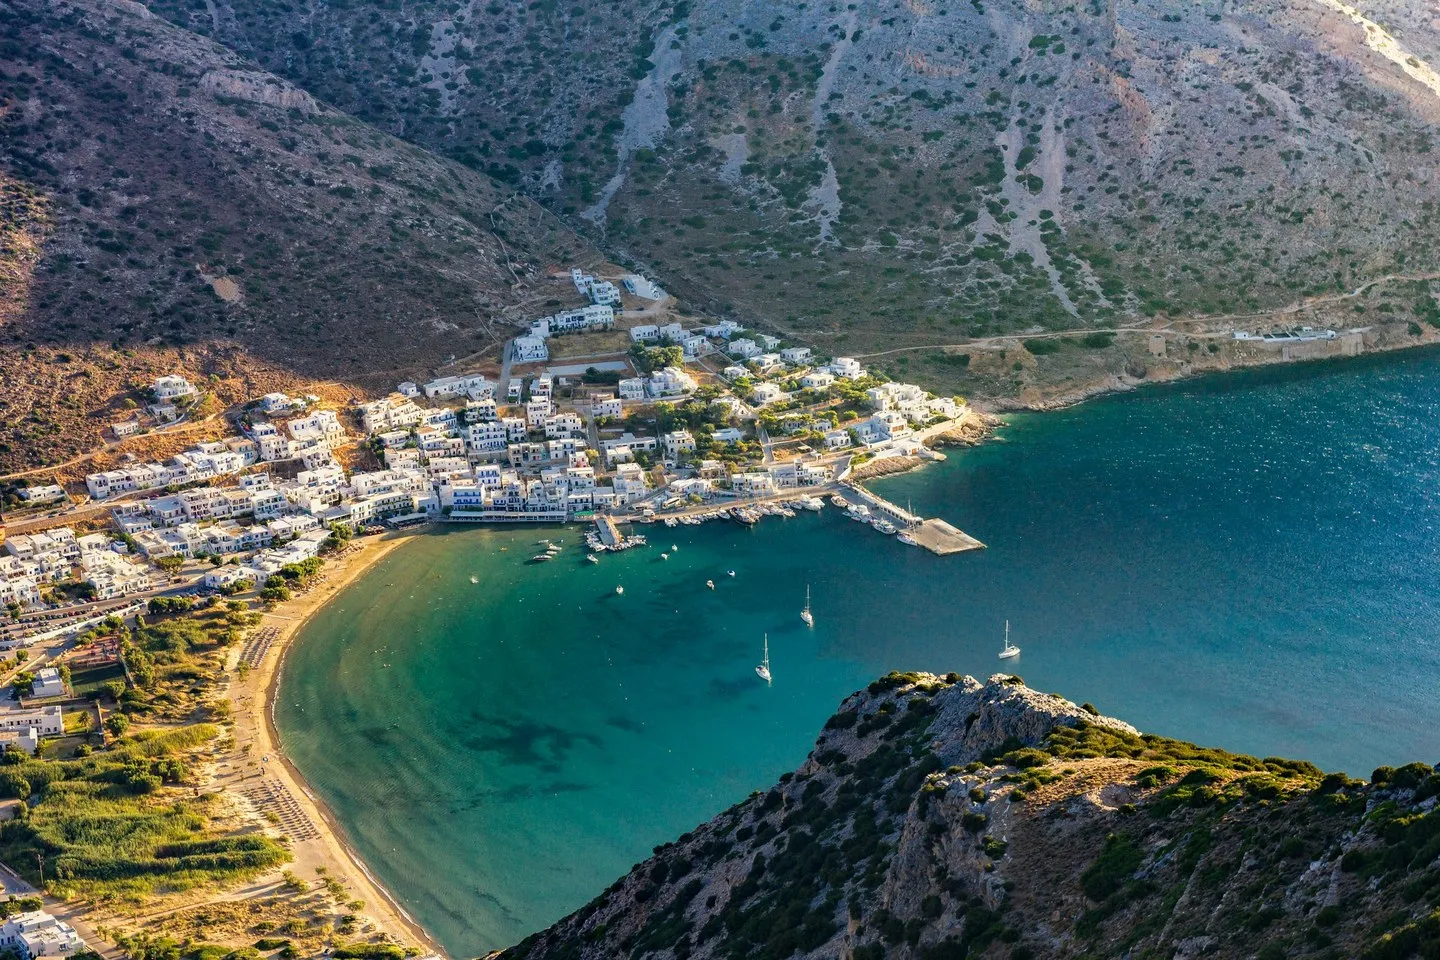
Photo: Gaetano Cessati on Unsplash, Kamares, Sifnos
The hotel stock by category
The supply side is just as useful to understand. ELSTAT’s 2025 release includes a table of the hotel stock, sourced from the Hellenic Chamber of Hotels.
| Category | Hotels | Rooms |
|---|---|---|
| 5-star | 869 | 112,074 |
| 4-star | 1,932 | 133,018 |
| 3-star | 2,971 | 100,428 |
| 2-star | 3,215 | 83,679 |
| 1-star | 1,131 | 21,366 |
| Total | 10,118 | 450,565 |
Source: ELSTAT, 2025 final data, citing the Hellenic Chamber of Hotels.
The shape is worth a second look. By count, most Greek hotels sit in the 2-star and 3-star categories, but the 4-star and 5-star categories hold the most rooms, because the upper-category properties are larger on average. Across all categories, the stock counted 902,328 beds, according to the same ELSTAT table.
For an owner of a smaller, older property, this means competing in the most crowded part of the market, often against larger hotels with more room to spend on marketing. For a buyer, it means there is a large pool of lower-category stock that could be upgraded, and each case needs its own numbers. Our guide to buying a boutique hotel in Greece sets out how to assess one.
Source markets and January–July 2026
In 2025, the Bank of Greece recorded receipts from Germany of €3,784.7m, up 2.2%, and from the UK of €3,741.6m, up 18.4%. US receipts rose 9.7% to €1,736.7m. Germany and the UK were almost level, but the UK was growing much faster.
The Bank of Greece July 2026 release shows that trend carrying on. In January–July 2026, travel receipts rose 12.0% to €13,518.3m and inbound traveller flows rose 8.6% to 20,043.3 thousand. UK receipts rose 23.3% to €2,091.6m, putting the UK ahead of Germany, where receipts fell 0.7% to €1,980.9m. US receipts rose 7.9% to €1,062.8m.
The Bank of Greece July 2026 release also shows why monthly data needs care. In July 2026, receipts rose 7.2% to €4,722.1m while inbound flows fell 3.1%, and average expenditure per trip was up 10.0%. Fewer travellers spending more per trip can still lift receipts, but not every hotel shares in that spending equally.
What this means for owners
The national data points in a clear direction: more visitors, shorter stays, more spent per night, and a peak that is slowly widening into the shoulder months. Few of those gains land evenly. Growth in Attica, softer receipts in Crete and the Ionian, and crowded lower and middle categories mean that each hotel’s position depends on its own market.
For owners, the practical steps are simple:
- Compare your own monthly occupancy with your region’s curve, not the national average.
- Price and staff for shorter stays, since each night sold carries more turnover cost.
- Look hard at the shoulder months, where the fourth quarter has gained ground since 2019.
- Know which source markets fill your hotel, and watch how they are moving.
None of this needs complex tools. It needs clean monthly data from your own property, a view of your competitors’ pricing, and the discipline to act on what the numbers show before the season starts rather than during it.
This is the work our strategic consulting and market analysis team does with owners before a repositioning, a sale or a new season. The data gives the direction, and the decisions still come down to the individual property.
Frequently asked questions
How many tourists visit Greece every year?
The Bank of Greece counts inbound travellers through its border survey, including cruise passengers, and ELSTAT counts arrivals at hotels and other accommodation. Both series grew, and visitors are spending more per night even as the average trip becomes shorter.
When is the peak tourism season in Greece?
July and August are the busiest months, and bed-place occupancy is highest in August. Demand builds from May and stays strong through September. The winter months are quiet across most of the country, which is why Greek demand is far more concentrated than the European average.
Which regions of Greece earn the most from tourism?
The South Aegean islands and Attica lead on tourism receipts, followed by Crete, the Ionian Islands and Central Macedonia. Attica, which includes Athens, has taken a growing share of visits and led the growth in both visits and receipts in the full-year data.
Is the Greek hotel market a good investment?
Demand and visitor spending have grown, but results vary a great deal by region, category and season length. A sound decision rests on the property's own trading history, its local market and a realistic operating plan, not on national averages. Owners should test those points before buying or repositioning.
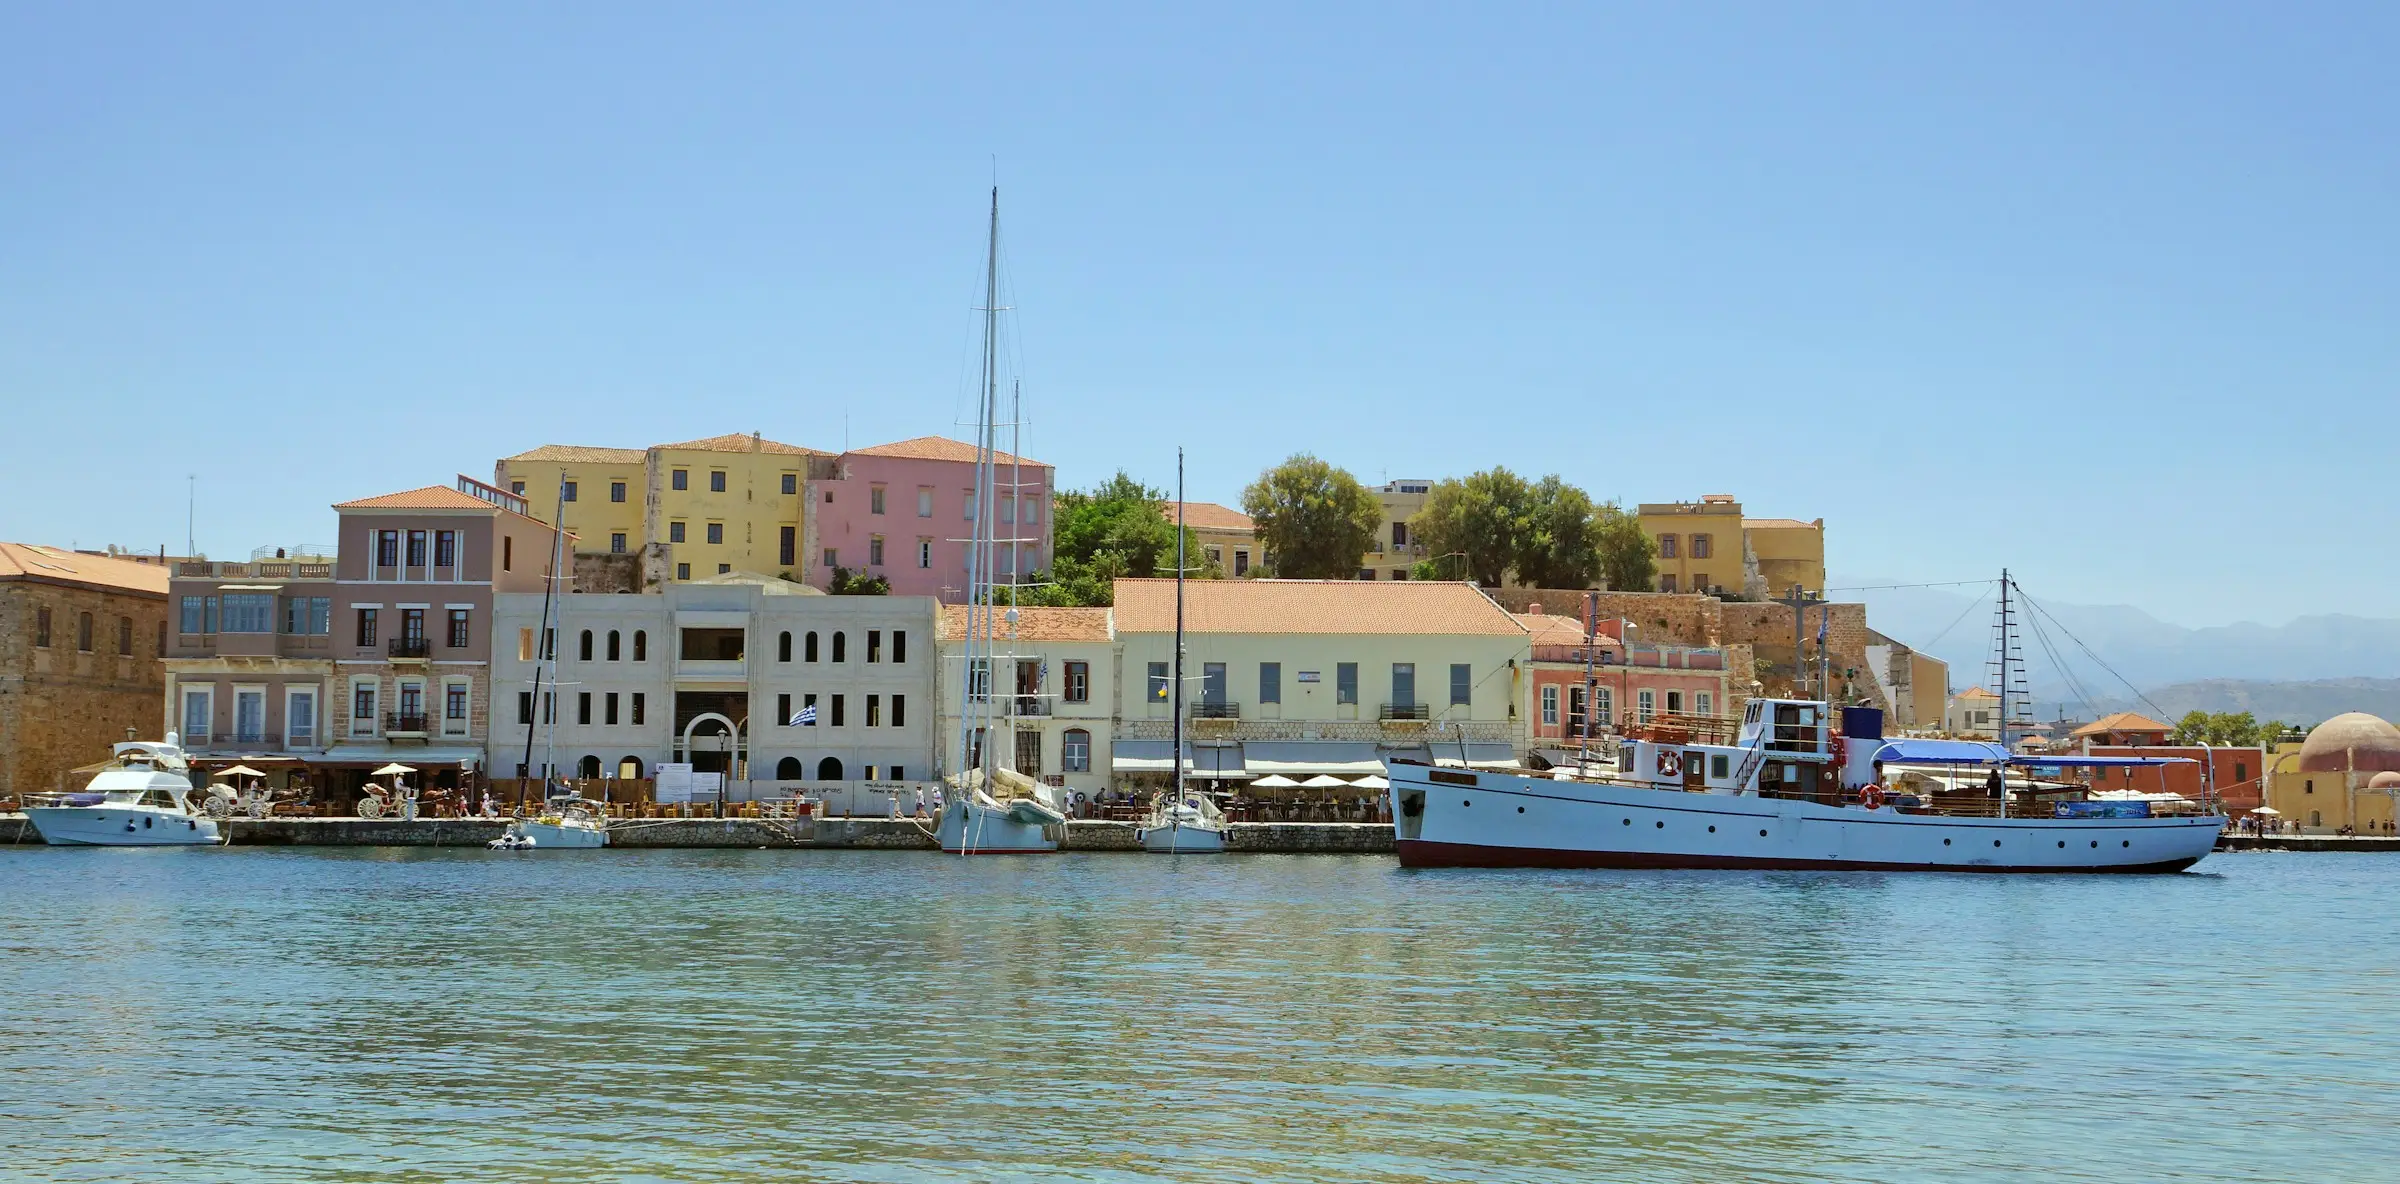
Cover photo: Martti Salmi on Unsplash, Chania, Crete. Unsplash License.